How the Delusion Score Is Calculated, Step by Step
On this page
- What the delusion score measures
- Why a number instead of a percentage
- Step 1: Start with the right population
- Step 2: Turn each standard into a probability
- Step 3: Multiply the probabilities, do not add them
- Step 4: Correct for traits that travel together
- Step 5: Turn the pool into a score from 1 to 10
- Step 6: Find the filter doing the most damage
- A worked example
- What a high or low score means
- Reading your score without spiraling
- Where the numbers come from
- Frequently asked questions
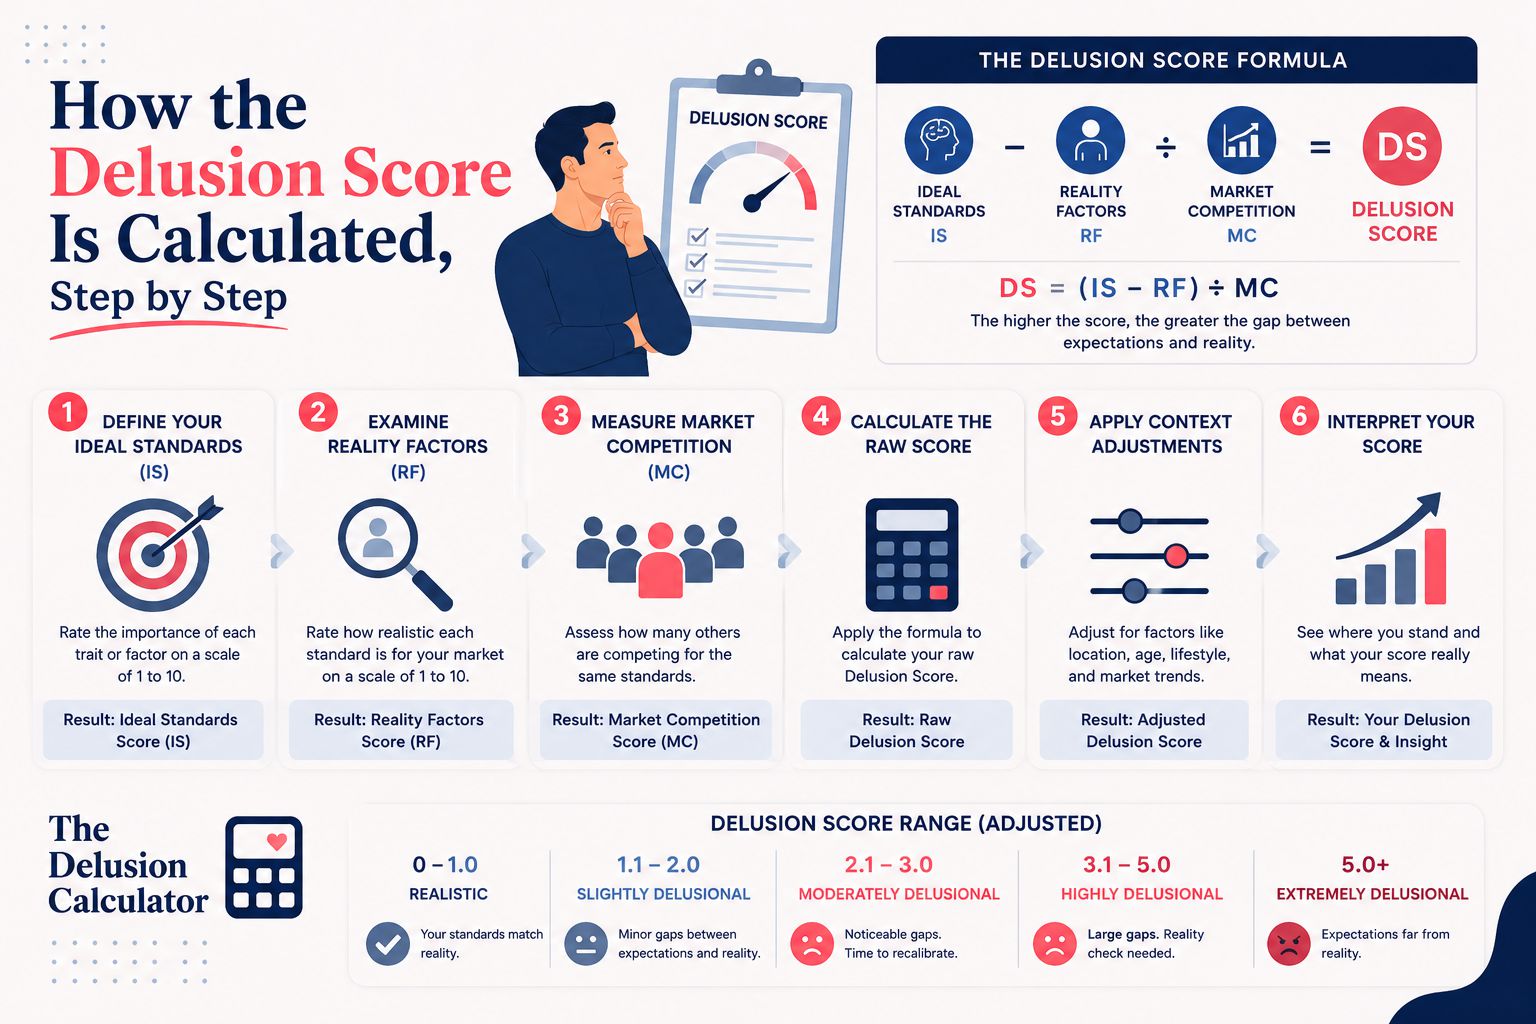
The delusion score is a number from 1 to 10 that rates how statistically rare your dating standards are. A 1 means almost everyone clears your bar. A 10 means the exact person you described barely exists. It reads like a personality quiz, but there's no opinion in it. Every point on that scale comes from real US population data and a short chain of arithmetic you can follow yourself. This guide walks through that chain, one step at a time, using the same numbers the calculator runs on.
By the end you'll know where the score comes from, why two fair-sounding filters can drag it from a 2 to a 6, and how to read your own result without taking it personally. Start with what the score is actually measuring.
What the delusion score measures
The delusion score measures rarity, not worth. It answers one question: out of all the adults you could realistically date, what fraction match every requirement you set? A small fraction earns a high score. A large fraction earns a low one. That's the whole idea.
Rarity and quality are not the same thing, and the number never pretends they are. Wanting a partner who is tall, comfortable financially, single, and a certain age is not wrong. It's just uncommon when you ask for all of it at once. The score puts a figure on "uncommon" so you can see it instead of arguing about it.
Why a number instead of a percentage
Percentages are hard to feel. Told that 0.2% of men fit your list, most people can't say whether that's picky or impossible. A single digit on a familiar 1 to 10 scale lands faster, and it lets two very different searches be compared at a glance. So the calculator does the percentage math under the hood, then hands you the friendlier number on top. The percentage is still there if you want it. The score is just the headline.
Step 1: Start with the right population
Population is where every calculation begins. The tool doesn't score you against all 262 million US adults. It scores you against the group you're actually seeking. A woman looking for men is measured against roughly 128 million adult men. A man looking for women is measured against about 134 million adult women. Pick "either" and the base spans the whole adult population.
This choice matters because men and women have different height curves, different earnings, and different age spreads. Starting from the wrong base would tilt every step that follows. So the first thing the engine does is pull the correct pool from US Census Bureau counts.
Step 2: Turn each standard into a probability
Standards become probabilities before anything else happens. Each filter you set is really a question about the population: what share of people pass it? The calculator answers that from a published distribution, then carries the answer forward as a decimal between 0 and 1. A few common filters in real terms, drawn from CDC and Census data:
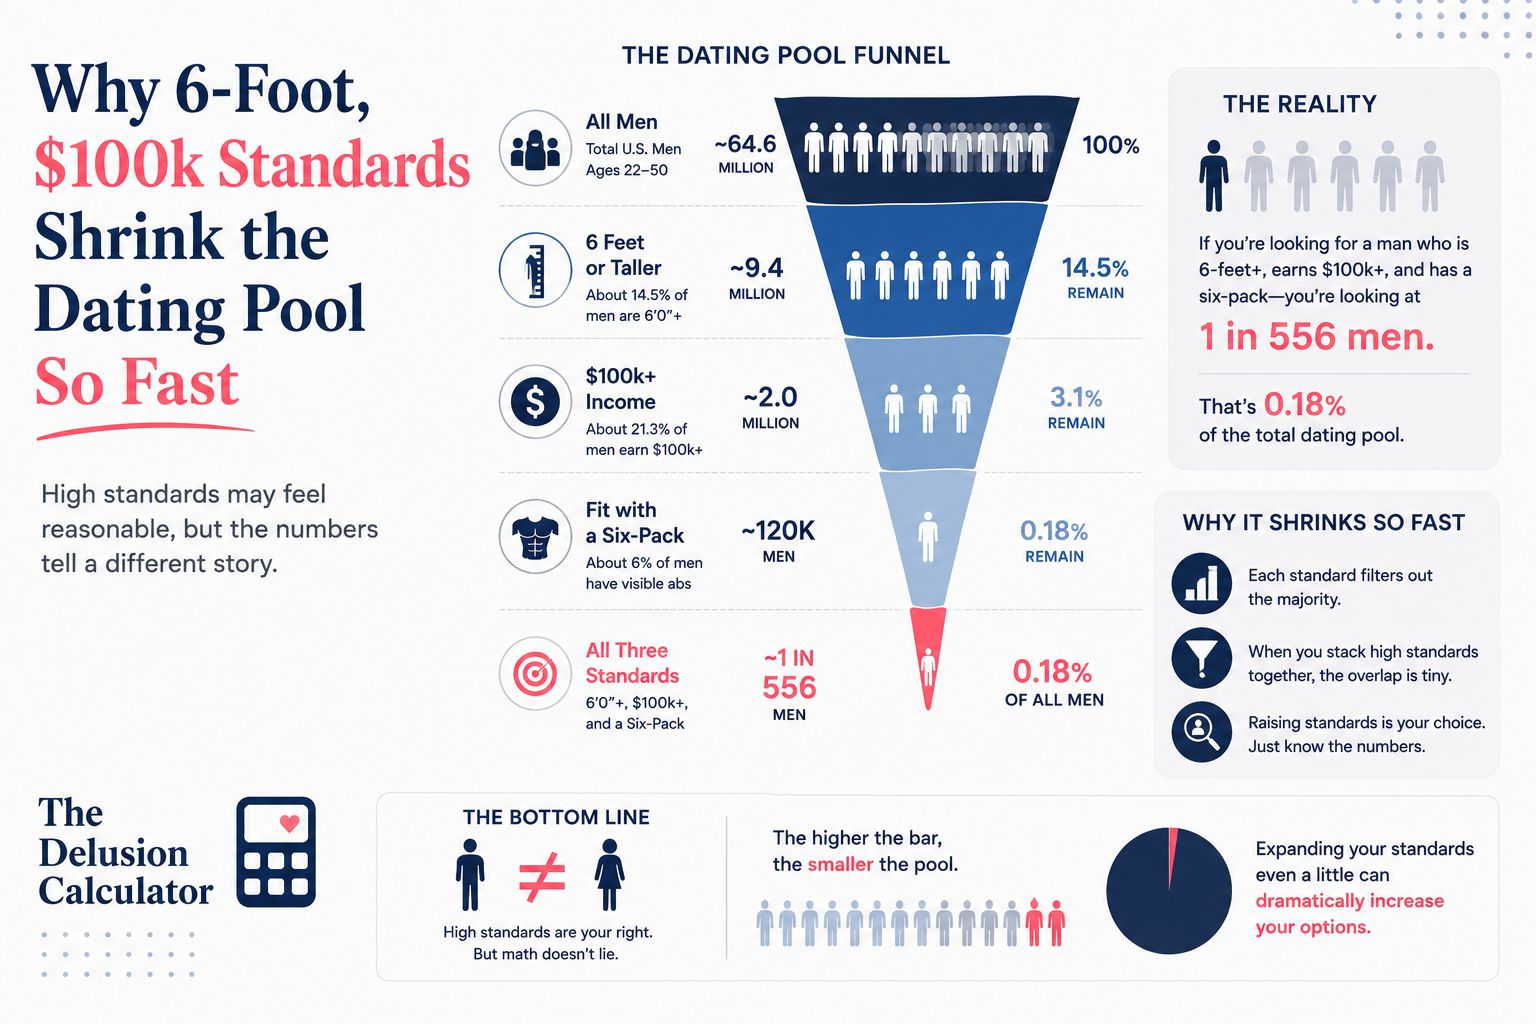
- Height. About 14.5% of US men stand six feet or taller. Ask for that and roughly 0.145 of the male pool survives.
- Income. Around 15% of individual men earn 100,000 dollars a year or more, so that filter keeps about 0.15.
- Body composition. Roughly 42% of US adults have a BMI of 30 or higher, so excluding that group keeps about 0.58.
- Availability. Close to a third of adults have never married, and the share swings hard by age, so the tool weights it against the ages you picked.
Each of those is a marginal probability: the odds a random person clears one hurdle, ignoring the rest for a moment. Step 3 is where they meet.
Step 3: Multiply the probabilities, do not add them
Multiplication is the step most people get wrong in their heads. When you stack two independent filters, the share that passes both is the product of the two, not the average and not the sum. Keep 15 men in 100 on income, then keep 14.5 in 100 of those on height, and about 2 in 100 remain.
Write it out and it's plain. 0.15 times 0.145 is 0.0217, a hair over 2%. Add a third filter at 0.6 and you fall to roughly 1.3%. Each new requirement doesn't trim the pool a little. It shaves a fraction off whatever was already left, which is why standards that feel modest one by one can compound into something tiny. That compounding is the engine of the whole score. But raw multiplication assumes filters are unrelated, and sometimes they aren't, which brings the next correction.
Step 4: Correct for traits that travel together
Correlation is the one place naive multiplication breaks. Income and education move as a pair in the real world. People with degrees earn more on average, so the men who clear a 100,000 dollar bar are already far more likely to hold a bachelor's. Multiply the two raw probabilities and you count the same people out twice, which makes the pool look rarer than it is.
The calculator fixes this by treating income and education as one linked group. Instead of a flat product, it anchors the joint odds to the more selective of the two and softens the second using a correlation strength called rho, set at 0.55. In plain words: if you demand a high income and a degree, the tool assumes a big chunk of high earners already have the degree, so it doesn't shrink the pool as hard. Every other pair, like height and income, stays independent, because no reliable joint data links them. The effect is real. On a search that filters for both income and a bachelor's, the correlation step can widen the resulting pool by 50% or more against blind multiplication. That's the gap between an honest estimate and a scary one.
Step 5: Turn the pool into a score from 1 to 10
Pool size arrives as a percentage, and the final step translates it into the 1 to 10 rating. The formula uses the base-10 rarity of your pool, which is really just the number of zeros in the "1 in X" ratio. Written out: score = 1 + 1.5 times the log base 10 of (1 divided by your pool fraction), capped between 1 and 10. You never run the log yourself. Here's how the ratio maps to the number:
| Your matching pool | Roughly | Delusion score |
|---|---|---|
| 1 in 2 | half the pool | about 1.5 |
| 1 in 20 | 5% of the pool | about 3 |
| 1 in 100 | 1% | about 4 |
| 1 in 1,000 | 0.1% | about 5.5 |
| 1 in 10,000 | 0.01% | about 7 |
| 1 in a million or rarer | near zero | 10 |
The scale is not linear, and that's on purpose. Going from a 4 to a 7 isn't three steps harder, it's a hundred times rarer. Rarity grows fast, and a straight scale would bunch every demanding search near the top and tell you nothing.
Step 6: Find the filter doing the most damage
Beyond the single number, the tool ranks your filters by how much each one costs and flags the smallest marginal probability, because that hurdle is clearing the fewest people. On a tall-plus-rich search, height is almost always the culprit, since 14.5% is a tighter gate than most income levels.
This is the part you can act on. Loosen the tightest filter by one notch and the pool usually jumps more than it would from easing anything else. The score isn't there to end the conversation. It's there to show you the one lever worth pulling.
A worked example
Example time, because the steps click once they run together. Say a woman wants a man between 27 and 37, six feet or taller, earning at least 100,000 dollars, single, and not obese. Watch the pool fall as each filter lands:
| Filter added | Keeps | Running pool |
|---|---|---|
| Start: US men | 100% | about 128 million |
| Ages 27 to 37 | about 20% | about 26 million |
| Six feet or taller | 14.5% | about 3.7 million |
| Earns 100k or more | about 18% at that age | about 680,000 |
| Single or available | about 55% | about 370,000 |
| Not obese | about 58% | about 215,000 |
The final pool lands near 215,000 men, roughly 1 in 600 of the men she could date, and a delusion score around 5. Two things stand out. First, no single filter was outrageous. Second, the age band and the height cut did most of the damage before income even entered. That's compounding at work, and it's exactly what the score captures.
What a high or low score means
A low score, 1 to 3, means your standards fit a wide slice of the population and options are plentiful. A middle score, 4 to 6, means you're selective in a way that still leaves a real pool, usually with one filter worth watching. A high score, 7 to 10, means the specific combination you asked for is genuinely rare, and the honest move is to decide which two or three traits truly matter.
None of that is a verdict on you. A 9 doesn't mean you're asking too much as a person. It means the math of stacking filters caught up with your list. Read it as a map of the market, not a report card.
Reading your score without spiraling
Spiraling is the wrong response to a high number, and it's an easy one. A rare pool is still a real pool. Even 0.1% of US men is more than a hundred thousand people, which is far more than anyone meets in a lifetime. The score describes a proportion, not a headcount of your prospects, and it says nothing about the person you'll actually click with. Use it the way you'd use a weather forecast: as information to plan around, not a sentence handed down about your future.
Where the numbers come from
Numbers this specific need a paper trail. Height and body composition come from the CDC's National Health and Nutrition Examination Survey, which physically measures people rather than trusting them to report their own height. Age, education, marital status, and ethnicity come from the US Census Bureau's American Community Survey. Income comes from the Census Current Population Survey and Bureau of Labor Statistics earnings data. The full source table, with years, sits on the methodology page.
Frequently asked questions
What is a good delusion score?
A good delusion score is anything from 1 to 4 if your goal is a wide dating pool. That range means your standards match a large share of people. Scores of 5 to 6 are still workable but selective, and 7 or higher means the mix you want is statistically uncommon. There's no pass or fail, only a trade between how specific you are and how many people qualify.
How is the delusion score calculated?
The delusion score is calculated by multiplying the real-world probability of each filter, adjusting income and education for their overlap, then mapping the final pool onto a 1 to 10 log scale. Rarer pools score higher. The entire calculation runs in your browser using US Census, CDC, and BLS distributions.
Does a higher score mean my standards are wrong?
No. A higher score means your combined standards are rarer, not worse. The number counts how many people match and never judges whether wanting those traits is reasonable. Plenty of people are happy holding out for a rare match, and that's a personal call the score can't make for you.
Which filter usually lowers the score the most?
Height and a narrow age range usually move the score most for people seeking men, while age and a fitness filter tend to dominate for people seeking women. The tool names your single biggest constraint on the results screen, so you can see which one is doing the damage in your case instead of guessing.
Is the delusion score scientific?
The delusion score is built on published government data and standard probability, so the inputs and the method are sound. It is not a peer-reviewed instrument, and it estimates a population share rather than predicting your love life. Treat it as an honest back-of-envelope calculation made rigorous, not a clinical test.
Can two people get the same score with different standards?
Yes. Two very different filter sets can land on the same score if they produce pools of the same size. A woman wanting a six-foot high earner and a man wanting a nonsmoker inside a very narrow age band could both score around 6, because rarity, not the specific traits, drives the number.
Does the calculator store my answers?
No. Every calculation runs locally in your browser with JavaScript. Your gender, preferences, and result never leave your device and are not sent to a server, saved, or tracked, so there's nothing for anyone to see.
How accurate are the numbers behind the score?
The numbers are as accurate as large US government surveys, which measure tens of thousands of people. They describe the national population rather than your city, so a local pool can differ, and they're estimates rather than a live count of singles. For a population-level reality check, they're about as solid as public data gets.
Is a low delusion score always better?
A low delusion score is better only if a large pool is your goal. It means many people match your standards, which helps when you want more options. Some people happily accept a high score because one trait matters more to them than choice does. The right score is the one that fits what you actually want, not the smallest possible number.
The delusion score, in the end, is compounding made visible. Run your own filters, watch the pool move, and use the biggest-constraint tip to decide what you'd actually trade. The math is honest. What you do with it is yours to choose.