On this page
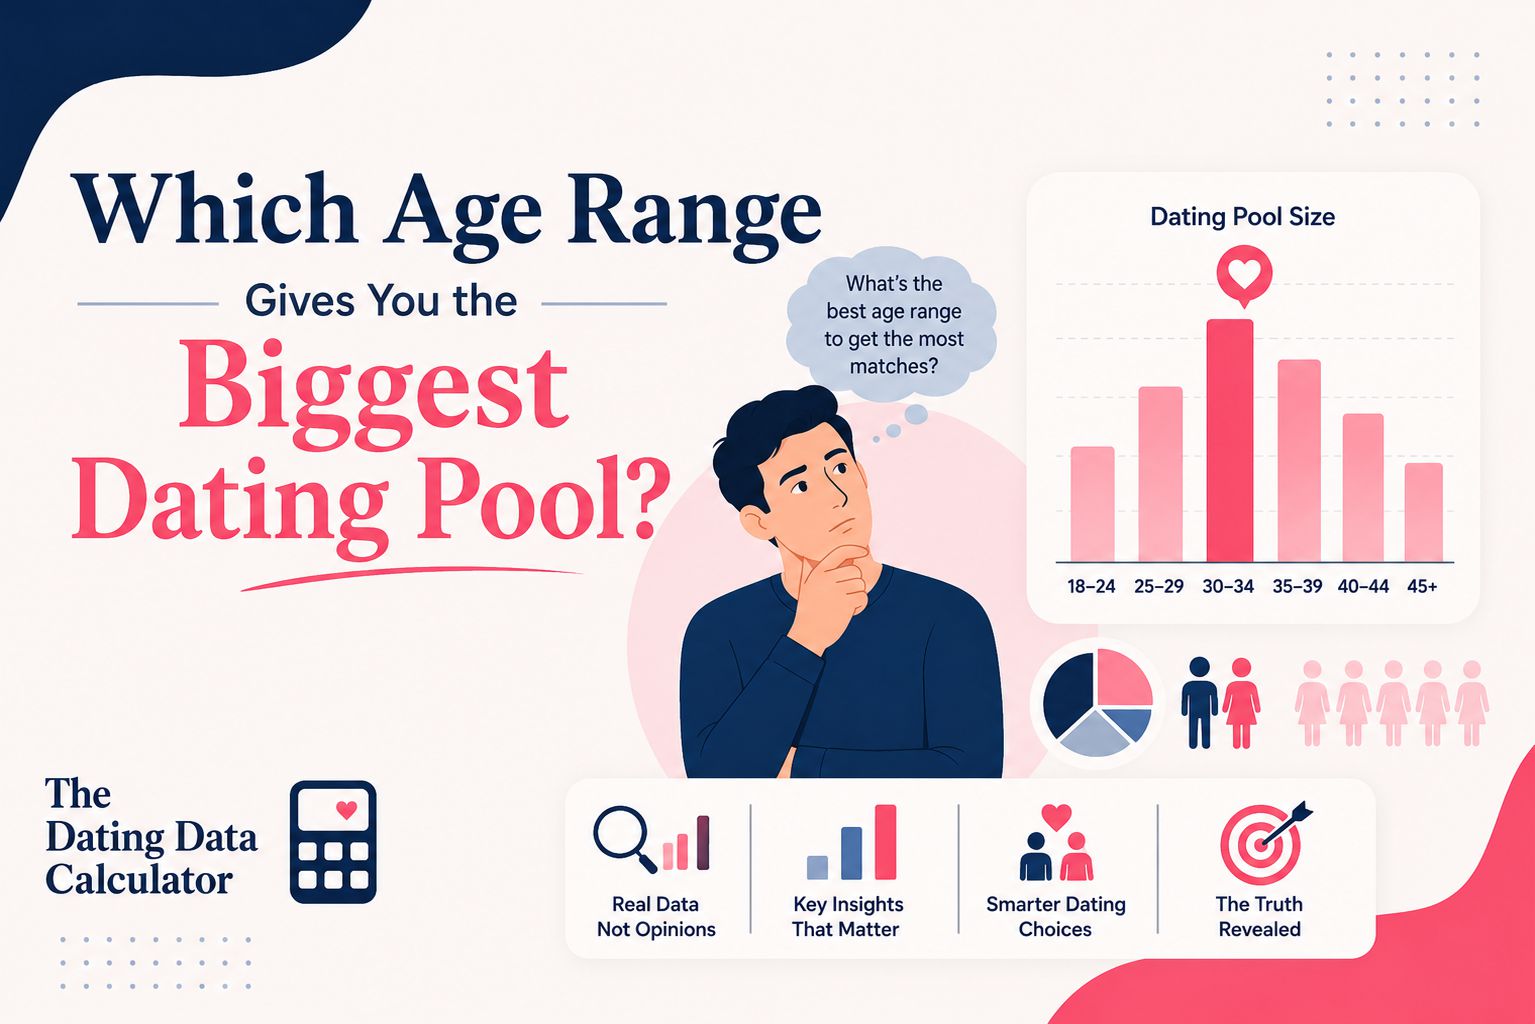
About 93% of American men aged 18 to 24 are not married. By 40 to 44 that falls to roughly 40%, and among men over 65 it settles near 31%. Read those three numbers and the dating pool looks like it evaporates. Look at the headcounts instead and a different picture appears: roughly 4.2 million unmarried men aged 40 to 44, and roughly 7.9 million aged 45 to 54. The pool does not dry up with age. It changes shape, it changes sex ratio, and it changes what "single" even means. This piece separates the four competing definitions, gives pool sizes band by band for both sexes, and shows where the balance tips.
"Single" means four different things
Single is the most abused word in dating statistics. Four organisations count four different populations, and the same 40 year old can be counted as single by one and partnered by another. Percentages that look contradictory usually are not; they answer different questions.
- Never married. A legal status from the Census marital-status tables. Excludes anyone divorced or widowed. Pew reports 25% of 40 year olds have never married.
- Unmarried. Never married plus divorced plus widowed. This is the Census Bureau's framing and the one our calculator uses, because a divorced man is available.
- Unpartnered. Living without a spouse or a live-in partner. Pew puts this at roughly 42% of all US adults and 86% of adults aged 18 to 24.
- Not currently dating. A behavioural measure that no federal survey collects, usually estimated from app data.
Watch what that does to a single age band. Among 40 year olds, "never married" gives 25% and "unpartnered" gives something far higher, because the second definition sweeps in every divorced person living alone. Neither figure is wrong. Quoting one while implying the other is. Everything below uses the unmarried definition, which is the one that matters when you're asking who is theoretically available.
Unmarried share by age band
Share falls fast through the twenties and thirties, then flattens. The steepest drop happens between 25 and 34, which is when most first marriages occur.
| Age band | Unmarried men | Unmarried women |
|---|---|---|
| 18 to 24 | 93% | 90% |
| 25 to 29 | 75% | 68% |
| 30 to 34 | 55% | 48% |
| 35 to 39 | 44% | 40% |
| 40 to 44 | 40% | 38% |
| 45 to 54 | 37.5% | 38.5% |
| 55 to 64 | 35% | 42% |
| 65 and over | 30.9% | 56.4% |
Two features stand out. The curve stops falling around 40 and never drops below roughly a third for men. And the columns cross: men are more likely to be unmarried until about 45, after which women are, decisively so past 65. Widowhood explains most of that reversal, since women outlive men by roughly five years. But percentages hide the number that actually matters.
Pool sizes, not percentages
Percentages shrink. Headcounts mostly do not, because the older age bands are wider and the population is bottom-heavy in a way people forget. Multiply each band's population by its unmarried share and the real pool appears.
| Age band | Unmarried men | Unmarried women |
|---|---|---|
| 18 to 24 | 15.0 million | 14.7 million |
| 25 to 29 | 9.1 million | 8.4 million |
| 30 to 34 | 6.6 million | 5.8 million |
| 35 to 39 | 4.9 million | 4.5 million |
| 40 to 44 | 4.2 million | 4.1 million |
| 45 to 54 | 7.6 million | 7.9 million |
| 55 to 64 | 7.3 million | 8.9 million |
| 65 and over | 7.9 million | 16.5 million |
Look at 45 to 54. The unmarried share there, 37.5% for men, is the lowest in the whole table, yet the band contains 7.6 million unmarried men, nearly double the count at 40 to 44. A decade-wide band simply holds more people than a five-year one. Anyone told the pool "dries up" after 45 is being shown a percentage and sold a headcount.
The genuine squeeze sits at 35 to 44, where narrow bands meet the lowest unmarried shares. That is the pinch point, and it lasts about ten years before the wider bands open up again. What changes alongside the count is who is standing in it.
The sex ratio flips around 40
Ratios tell you about competition, not just supply. Nationally there are about 89.8 unmarried men for every 100 unmarried women, which reads like a shortage of men until you split it by age.
Among adults in their early thirties the ratio runs well above parity, close to 120 unmarried men per 100 unmarried women, because men marry later and are counted as available for longer. Past 55 the ratio collapses to roughly 57 men per 100 women, driven by earlier male mortality and by widowhood. The national average is a blend of those two worlds, and it describes almost nobody.
Geography stretches it further. Washington DC has among the fewest unmarried men per 100 unmarried women, near 80. Alaska has among the most, near 117. A woman searching in her early thirties in Anchorage and a woman searching at 60 in Washington are not playing the same game, and no national statistic will tell either of them that.
Never-married rates are climbing
Marriage is arriving later, and for a growing minority it is not arriving at all. The share of 40 year olds who have never married reached 25% in 2021, against 20% in 2010 and just 6% in 1980. Median age at first marriage now sits near 30.2 for men and 28.6 for women, up from roughly 23 and 20 in 1960.
Education splits the trend sharply. Among 40 year olds, 33% of those with a high school education or less have never married, against 18% of those holding a bachelor's degree or higher. And roughly 22% of never-married adults aged 40 to 44 were cohabiting, which is precisely why the never-married figure overstates availability.
So the pool at any given age is larger today than it was for your parents at the same age. Later marriage means more unmarried people in every band from 25 to 45. That's the opposite of the story the phrase "the pool dries up" implies, and it changes what a narrow age filter really costs.
What an age filter does to a search
Age filters are the most underestimated setting in any dating search. A ten-year window feels generous. It removes roughly 80% of adults before a single other preference applies.
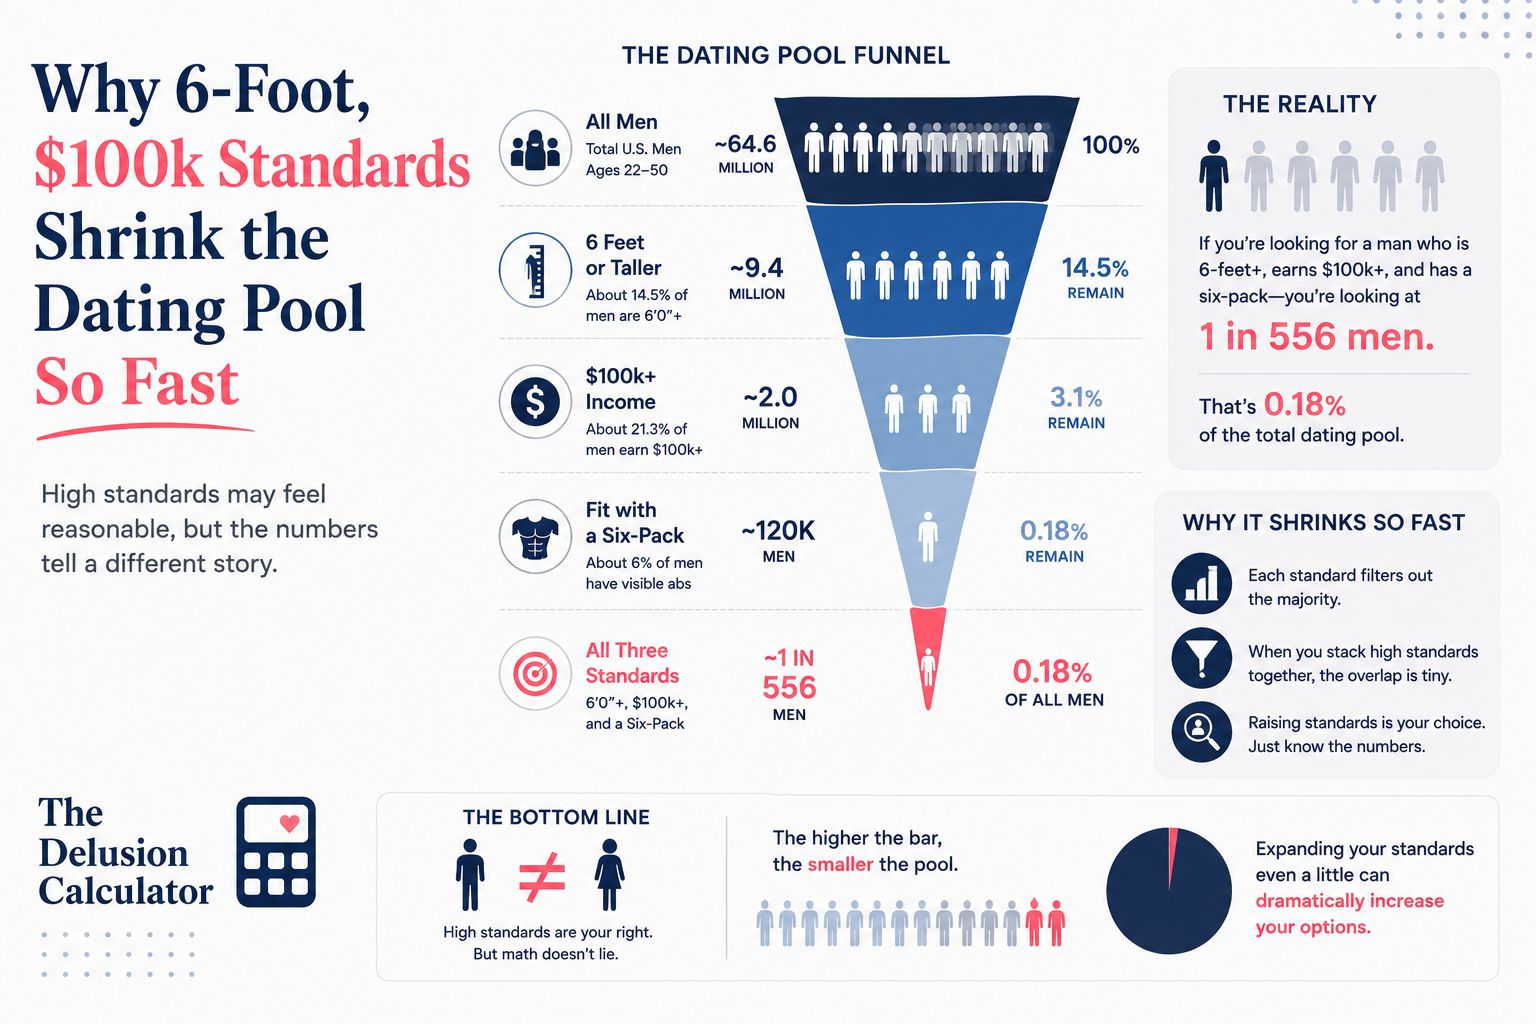
Take a woman seeking men aged 27 to 37 who are unmarried. That band holds about 20% of adult men, and roughly 55% of them are unmarried, leaving around 14 million. Add a six-foot height floor and a $100,000 income and the survivors fall under 400,000. Widen the band to 25 to 40 and the pool grows by nearly half, without touching height or income at all.
Which is the practical lesson. Loosening five years of age usually buys more options than dropping an income requirement, and it costs most people less. You can test the trade in about a minute with the female delusion calculator, or the male delusion calculator if you're screening women.
Where these numbers come from
Marital status by age and sex comes from the US Census Bureau's American Community Survey, principally table S1201. Sex ratios among unmarried adults come from Census analysis of the same survey. Never-married trends and the cohabitation adjustment come from Pew Research Center, which draws on the Current Population Survey. Population counts come from Census adult estimates.
Our unmarried shares are age-weighted rather than taken from a single band, so a search spanning 27 to 37 uses the actual mix of ages inside it. Sources, years, and the exact combining formula are listed on the methodology page.
Frequently asked questions
Does the dating pool shrink with age?
Yes as a percentage, no as a headcount. The unmarried share of men falls from 93% at 18 to 24 down to about 40% by 44, then flattens. But the 45 to 54 band still contains 7.6 million unmarried men, more than the 40 to 44 band, because wider age bands hold more people.
What percentage of 30-year-olds are single?
Roughly 55% of men and 48% of women aged 30 to 34 are unmarried, which counts the never married, divorced, and widowed together. Restrict the definition to never married and the figures drop sharply, because a rising share of thirty-somethings have already married and divorced.
What does "unpartnered" mean?
Unpartnered means living without a spouse and without a live-in partner. Pew uses it to capture people who are romantically unattached in practice rather than merely unmarried on paper, and reports that about 42% of US adults fall into it, rising to 86% among adults aged 18 to 24.
Are men or women more likely to be single?
Men until about 45, women after. Men marry later, so 75% of men aged 25 to 29 are unmarried against 68% of women. The columns cross in the late forties, and by 65 roughly 56% of women are unmarried against 31% of men, largely through widowhood.
What is the ratio of single men to single women?
Nationally there are about 89.8 unmarried men per 100 unmarried women. The average conceals a wide swing: the ratio runs above parity for adults in their early thirties and falls to roughly 57 men per 100 women among those 55 and over.
Which is rarer, an unmarried man at 30 or an unmarried man at 55?
The 55 year old is rarer as a share, at 35% against 55% at age 30. As a raw count the picture reverses: the 55 to 64 band holds about 7.3 million unmarried men against 6.6 million in the narrower 30 to 34 band.
At what age does the dating pool get hardest?
Between 35 and 44, where narrow five-year bands meet the lowest unmarried shares. Roughly 4.9 million unmarried men occupy the 35 to 39 band and 4.2 million the 40 to 44 band, the smallest counts in the adult table. The wider bands after 45 open up again.
What is the median age at first marriage in the US?
Median age at first marriage stands near 30.2 for men and 28.6 for women. Both figures have climbed steadily from roughly 23 and 20 in 1960, which is the single biggest reason more people in their late twenties and thirties are unmarried today than in any prior generation.
How many 40-year-olds have never married?
About 25% of 40 year olds have never married, a record high, against 20% in 2010 and 6% in 1980. Roughly 22% of never-married adults aged 40 to 44 live with a partner, so the never-married figure overstates how many are actually available.
Does education change how likely someone is to marry?
Yes, substantially. Among 40 year olds, 33% of those with a high school education or less have never married, against 18% of degree holders. The gap has widened over four decades and now runs in the opposite direction from the popular assumption that education delays marriage indefinitely.
Why do different articles give different single percentages?
They count different populations. Never married, unmarried, unpartnered, and not-currently-dating are four distinct measures, and for the same age band they can range from 25% to 86%. Check which definition a statistic uses before comparing it with another.
Does widening my age range help more than dropping other filters?
Usually yes. A ten-year age window already removes about 80% of adults before any other preference applies, so stretching it to fifteen years can lift the pool by half. Loosening an income floor or an inch of height rarely buys as much.
Is the pool bigger for singles today than a generation ago?
Yes, at every age from 25 to 45. Median age at first marriage has climbed to roughly 30 for men and 29 for women, up from about 23 and 20 in 1960, so far more people in their late twenties and thirties remain unmarried now than did then. Later marriage widens the pool rather than shrinking it.
Where are there the most single women relative to men?
In older age bands and in a handful of coastal cities. Washington DC records roughly 80 unmarried men per 100 unmarried women, among the lowest in the country, while the national ratio falls to about 57 men per 100 women once you count only adults 55 and over.
Age moves the pool more than almost anything else people argue about, and it does so quietly. Set your own band, watch the headcount rather than the percentage, and decide how many years you're really willing to spend.