Male Delusion vs Female Delusion: What the Data Actually Shows
On this page
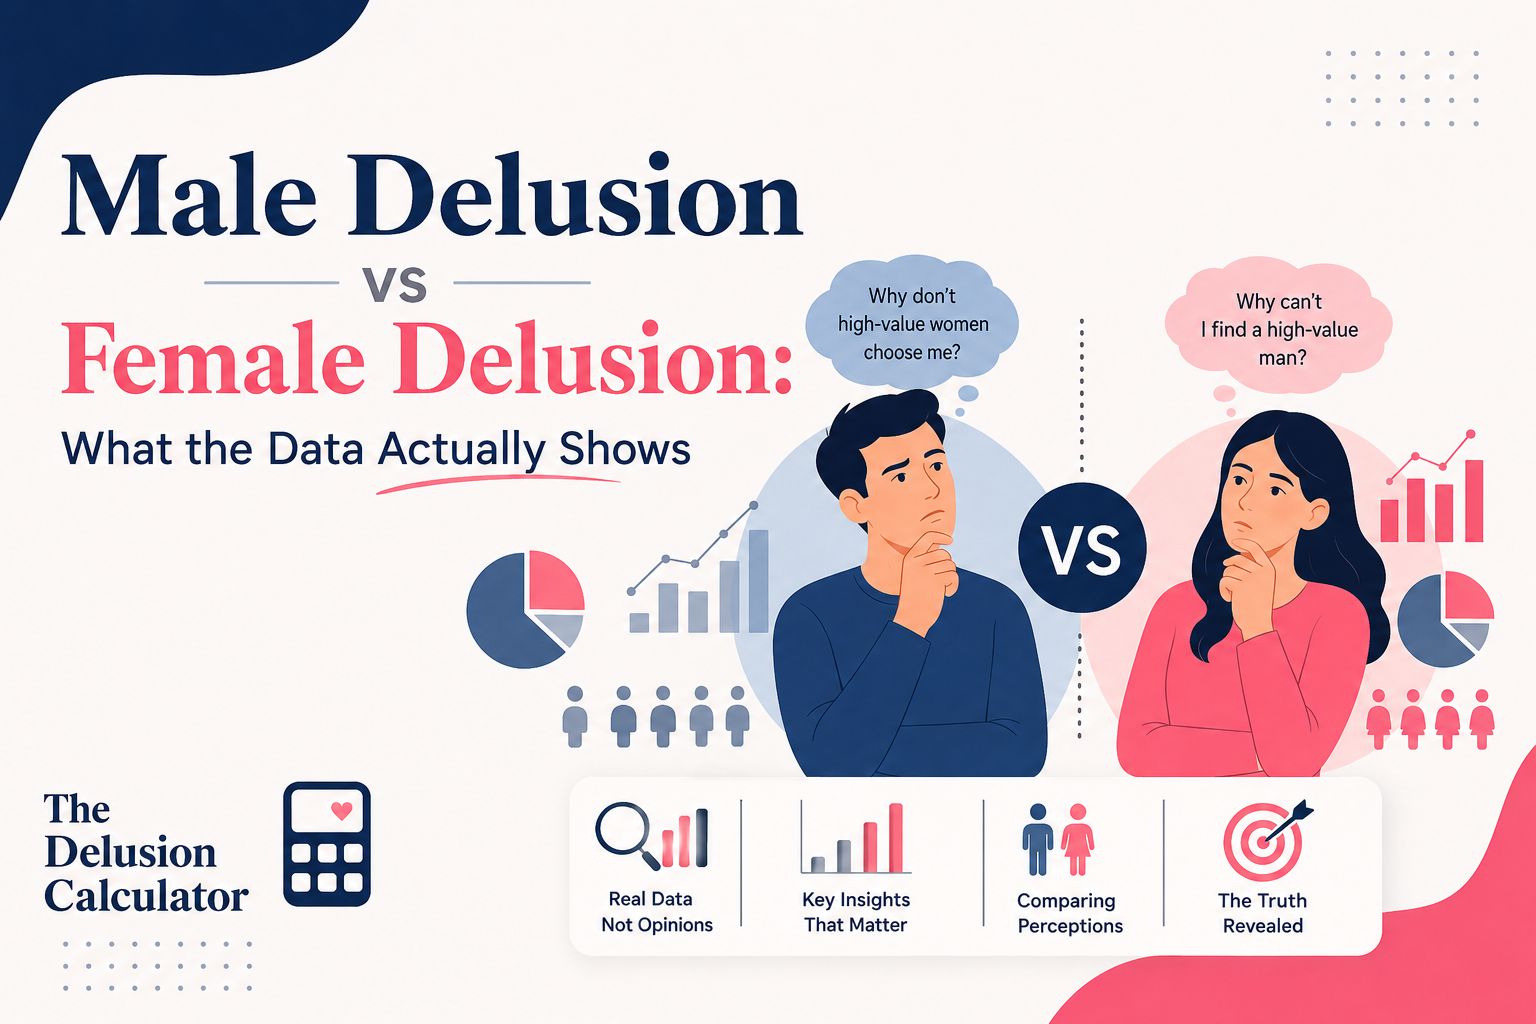
Male delusion and female delusion describe the same arithmetic pointed at different populations. A woman's standards are scored against 128 million adult American men. A man's standards are scored against 133.7 million adult American women. The engine multiplying those filters does not know or care which direction it runs. What changes is which filter does the damage: for a woman screening men, height and income collapse the pool fastest; for a man screening women, age and body composition do. This article runs identical searches in both directions, lays the mirrored statistics side by side, and answers the question everyone actually arrives with, which is whether one gender scores higher.
What the two calculators actually do
Calculators of this kind take a list of preferences and return the share of the target population that satisfies every one at once. The male delusion calculator filters women by a man's stated criteria. The female delusion calculator filters men by a woman's. Same distributions, same combining formula, same 1 to 10 rarity score.
Nothing in the method treats one sex as the subject and the other as the object. Swap the inputs and the roles reverse exactly. The reason results feel asymmetric is that men and women are not distributed identically across height, earnings, age, and marital status. Those differences, not the method, produce every gap you are about to see.
The mirrored statistics
Mirrors are the fastest way to see where the asymmetry actually lives. Each row below pairs a trait with its counterpart in the other population, drawn from CDC and Census data.
| Trait | US men | US women |
|---|---|---|
| Adult population | 128.3 million | 133.7 million |
| Earns $100,000 or more | 18% | 9.8% |
| Holds a bachelor's degree or higher | 36.2% | 39.1% |
| Not obese (BMI under 30) | 57.0% | 58.1% |
| Stands 6 feet or taller | 14.8% | 0.1% |
| Stands 5 foot 8 or taller | 50.6% | 5.2% |
| Aged 25 to 34 and unmarried | 6.5 million | 5.8 million |
Two rows deserve attention. Men are close to twice as likely to earn six figures, which is why an income filter cuts twice as hard when aimed at women. And women now out-graduate men, which quietly inverts the education filter: a man requiring a degree is filtering a slightly friendlier population than a woman doing the same. Height is the most lopsided trait in either direction. Which brings us to the searches themselves.
The same engine, run both ways
Symmetry claims are cheap. So we ran three real searches through the identical engine and recorded what came back. Each search excludes married people and excludes obesity, so only the distinguishing filters differ.
| Search | Matching pool | Rarity | Delusion score |
|---|---|---|---|
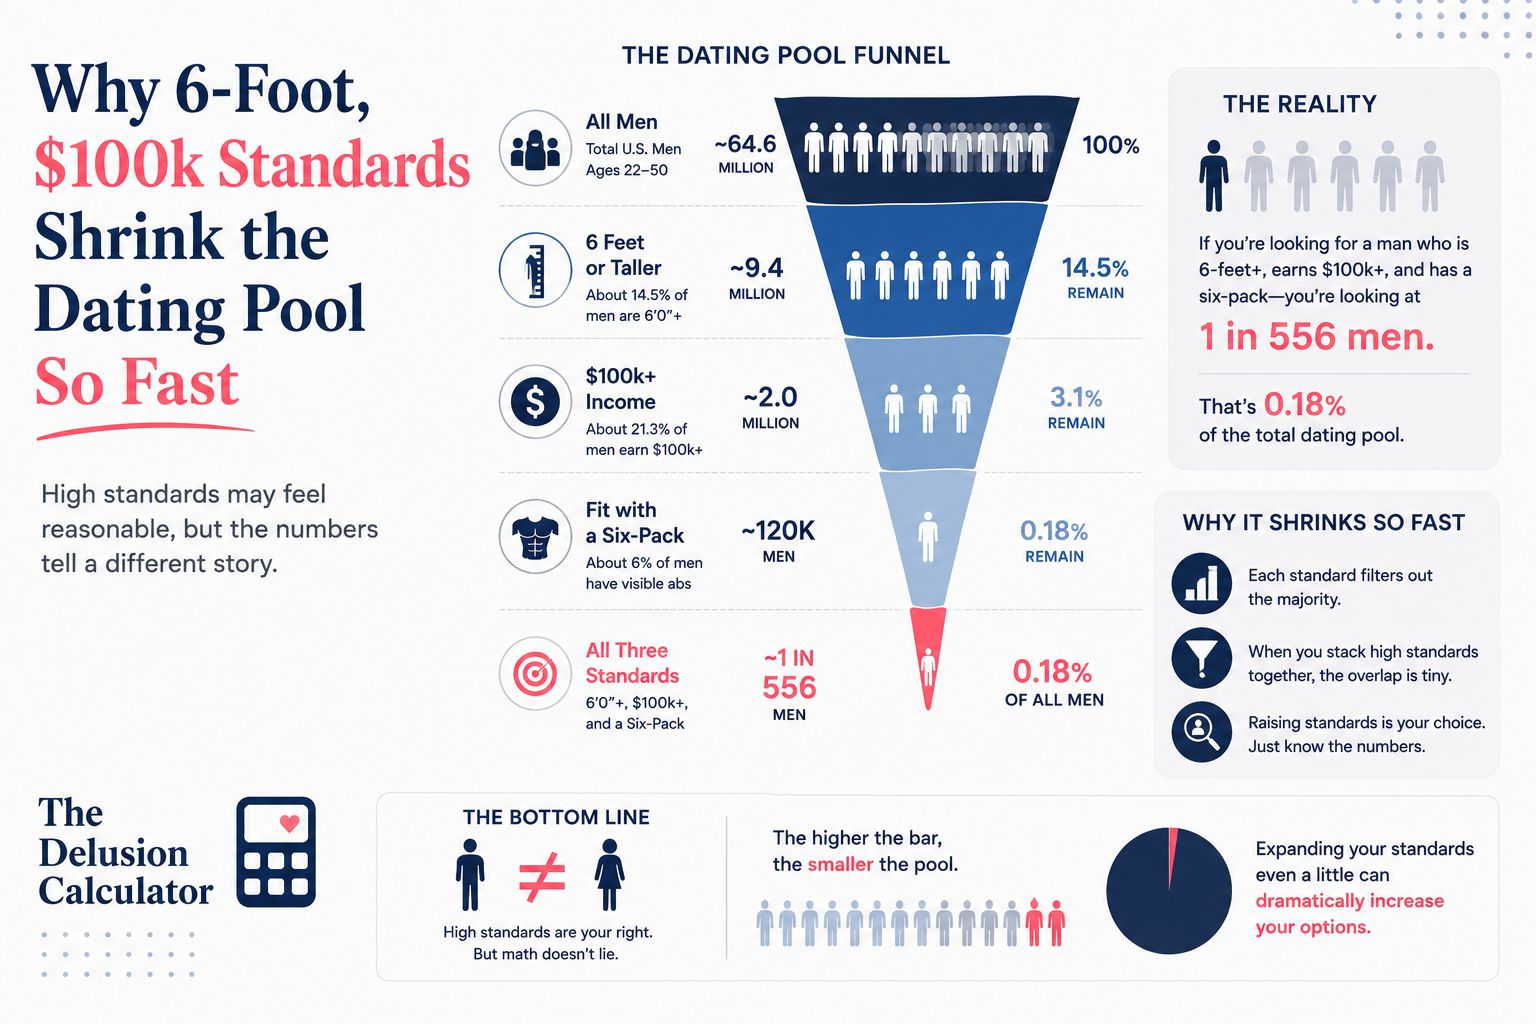
| Woman seeking a man: 27 to 37, 6 feet or taller, $100k or more | 0.18% | 1 in 566 | 5.1 |
| Man seeking a woman: 22 to 30 | 6.55% | 1 in 15 | 2.8 |
| Man seeking a woman: 22 to 28, degree, $50k or more | 1.23% | 1 in 81 | 3.9 |
Read those rows carefully before drawing a conclusion. The first search scores highest, but it also carries two extra filters. The second is not evidence that men ask for less. It's evidence that a bare age band is a weak filter. Give the man three requirements instead of one and his score climbs to 3.9, and he's still filtering a friendlier distribution because the traits he asked for are more common among women than six feet and six figures are among men.
So the honest summary is this. Score differences come from the rarity of the traits requested, not from the sex of the person requesting them. Ask for equally rare things and you get equally high scores. That principle survives every search we ran.
Which filters do the damage in each direction
Damage is not evenly distributed across the filters people actually use. Aimed at men, height is the tightest gate: six feet keeps 14.8% before anything else applies. Income follows at 18%. Stack the two and only 2.7% of men survive, which is why the 6-6-6 rule produces such small numbers.
Aimed at women, the tightest gate is usually the age band. A five-year window in the twenties holds under a fifth of adult women, and a narrow window holds far less. Body composition follows, because roughly 42% of American women have a body mass index of 30 or above, so a fitness filter removes a large share in one stroke. Income barely registers as a filter men apply, though when they do it bites harder than it would on men.
Notice what this means for advice. Telling a woman to relax her income floor helps less than telling her to drop an inch of height. Telling a man to relax his fitness filter helps less than telling him to widen his age band by five years. The gate doing the most work is rarely the one people argue about.
Is one gender more delusional?
Neither, as a matter of arithmetic. The engine returns a rarity score, and rarity is a property of the request, not the requester. A man asking for a woman who is 24, earns six figures, and holds a graduate degree will score higher than a woman asking for a man who is 5 foot 10 and employed. Nothing in the data privileges either direction.
What is true is that the traits popularly demanded of men are, in the current US distribution, rarer than the traits popularly demanded of women. Six feet is a top-15% trait. A six-figure income is a top-18% trait. Being aged 25 to 30 is roughly a one-in-five trait, and being non-obese is a coin flip. That asymmetry belongs to the distributions, not to anyone's character.
Anyone using either calculator as ammunition has misread it. A high score means the exact combination is uncommon. It does not mean the person holding the standards is foolish, entitled, or doomed. We say the same thing on the disclaimer, and we mean it in both directions.
Where the two calculators genuinely differ
Differences are limited to the input data, and they are worth naming precisely.
- Height curves. Men average 175.4 cm and women 161.5 cm, so a 5 foot 8 filter is trivial for men and severe for women.
- Earnings curves. Male income runs higher at every threshold, so the same dollar floor keeps roughly twice as many men as women.
- Marital status by age. Older women are far more likely to be unmarried than older men, largely through widowhood, which reverses the availability advantage after about 55.
- Population base. Women outnumber men among adults by roughly 5.4 million, and the gap widens with age.
Everything else is shared. The correlation adjustment between income and education applies identically. The 1 to 10 scale is identical. The privacy model is identical, which is to say nothing you type leaves your browser.
How the score is built
Scores rest on compound probability. Each filter's real-world share is multiplied by the others, because a man's height tells you nothing about his income. Two filters at 15% each do not leave 15%. They leave about 2%.
One pair gets a correction. Income and education travel together, since higher earners are far more likely to hold degrees, so multiplying their raw shares would penalise the same people twice. The engine anchors that pair to the more selective of the two, which widens the estimate back toward reality. The full formula, with the correlation strength and the source year for every table, is published on the methodology page.
Frequently asked questions
What is the difference between the male and female delusion calculator?
The two tools use the same engine against different populations. The male version scores a man's standards against US women; the female version scores a woman's standards against US men. Because male and female height, income, and age distributions differ, identical filters return different pool sizes.
Is one gender more delusional than the other?
No. The score measures how rare a requested combination is, not who requested it. Ask for equally uncommon traits in either direction and the scores match. Popular demands made of men happen to be rarer in the current distribution, which is a fact about the population rather than about anyone's judgment.
What does a delusion score of 7 mean?
A score of 7 means your combined filters describe roughly 1 in 10,000 people in the target population. Scores of 1 to 3 indicate a wide pool, 4 to 6 a selective but workable one, and anything above 7 marks a combination that is genuinely uncommon rather than merely demanding.
Which filters shrink each dating pool the most?
Height and income dominate when filtering men, at 14.8% and 18% respectively. Age band and body composition dominate when filtering women, since a five-year age window holds under a fifth of adult women and roughly 42% have a BMI of 30 or above.
Which is rarer, a six-foot man or a woman earning six figures?
A woman earning six figures is rarer. About 9.8% of adult women clear $100,000 against 14.8% of men who reach six feet. Both are uncommon, but the income filter aimed at women cuts roughly a third harder than the height filter aimed at men.
Do the calculators use the same data sources?
Yes, identical ones. Height and obesity come from CDC NHANES, age, education, and marital status from the Census American Community Survey, and income from the Census Current Population Survey with Bureau of Labor Statistics earnings tables. Only the sex-specific curves differ.
Can men use the female delusion calculator, or the reverse?
Yes, and it is genuinely useful. Running the opposite tool shows which traits the other side screens for and how rare those combinations are. The generic calculator also lets you select men, women, or either, and applies the matching population automatically.
Does a high score mean I should lower my standards?
No, it means your combination is rare. Plenty of people accept a small pool because one trait matters more to them than choice does. The score exists to show which single filter costs the most options, so the trade is made deliberately rather than by accident.
Why does income lower the score so sharply?
Income multiplies against every other filter rather than adding to them. A $100,000 floor keeps 18% of men and 9.8% of women, and that fraction is applied to whatever the previous filters already left. Stack it behind a height or age filter and the survivors fall by roughly four fifths in one step.
Is the male delusion calculator the same as a male reality calculator?
Yes, the names describe the same tool. Male reality calculator, man reality calculator, and male standards calculator all refer to scoring a man's dating preferences against real population data. No meaningful methodological difference separates them.
Do the tools account for the correlation between income and education?
Yes. Higher earners are disproportionately degree holders, so multiplying the two raw probabilities would count the same men and women out twice. The engine treats them as one linked pair, which widens the resulting pool by 50% or more against blind multiplication.
Are my answers stored when I use either calculator?
No. Both tools run entirely in your browser using JavaScript. Your gender, preferences, and result never reach a server, never enter a database, and are gone when you close the tab.
Does the availability advantage flip between men and women at some age?
Yes, at around 45. Men marry later, so they stay unmarried longer through their twenties and thirties, at 75% single at 25 to 29 against 68% of women. Past the mid forties the balance reverses, and by 65 roughly 56% of women are unmarried against 31% of men, mostly through widowhood.
Should men and women read a high delusion score differently?
No, the score means the same thing in both directions: your exact combination of filters is rare. What differs is the cheapest way to lower it. A woman usually gains most by dropping an inch of height, while a man usually gains most by widening his age band. The lever changes; the reading does not.
Same math, two directions, and no verdict about anybody's character. Run your own filters in whichever direction applies, find the one gate doing the most damage, and decide for yourself whether it earns its keep.