On this page
- One setting outweighs all the others
- Step one: how many people are in each band
- Step two: how many of them are unmarried
- The full picture, band by band
- Rolling the bands into decades
- Why the biggest count is not the best choice
- What widening the range actually buys you
- Men and women set very different ranges
- How to pick your band in four steps
- Where age stacks with everything else
- Quick summary
- Frequently asked questions
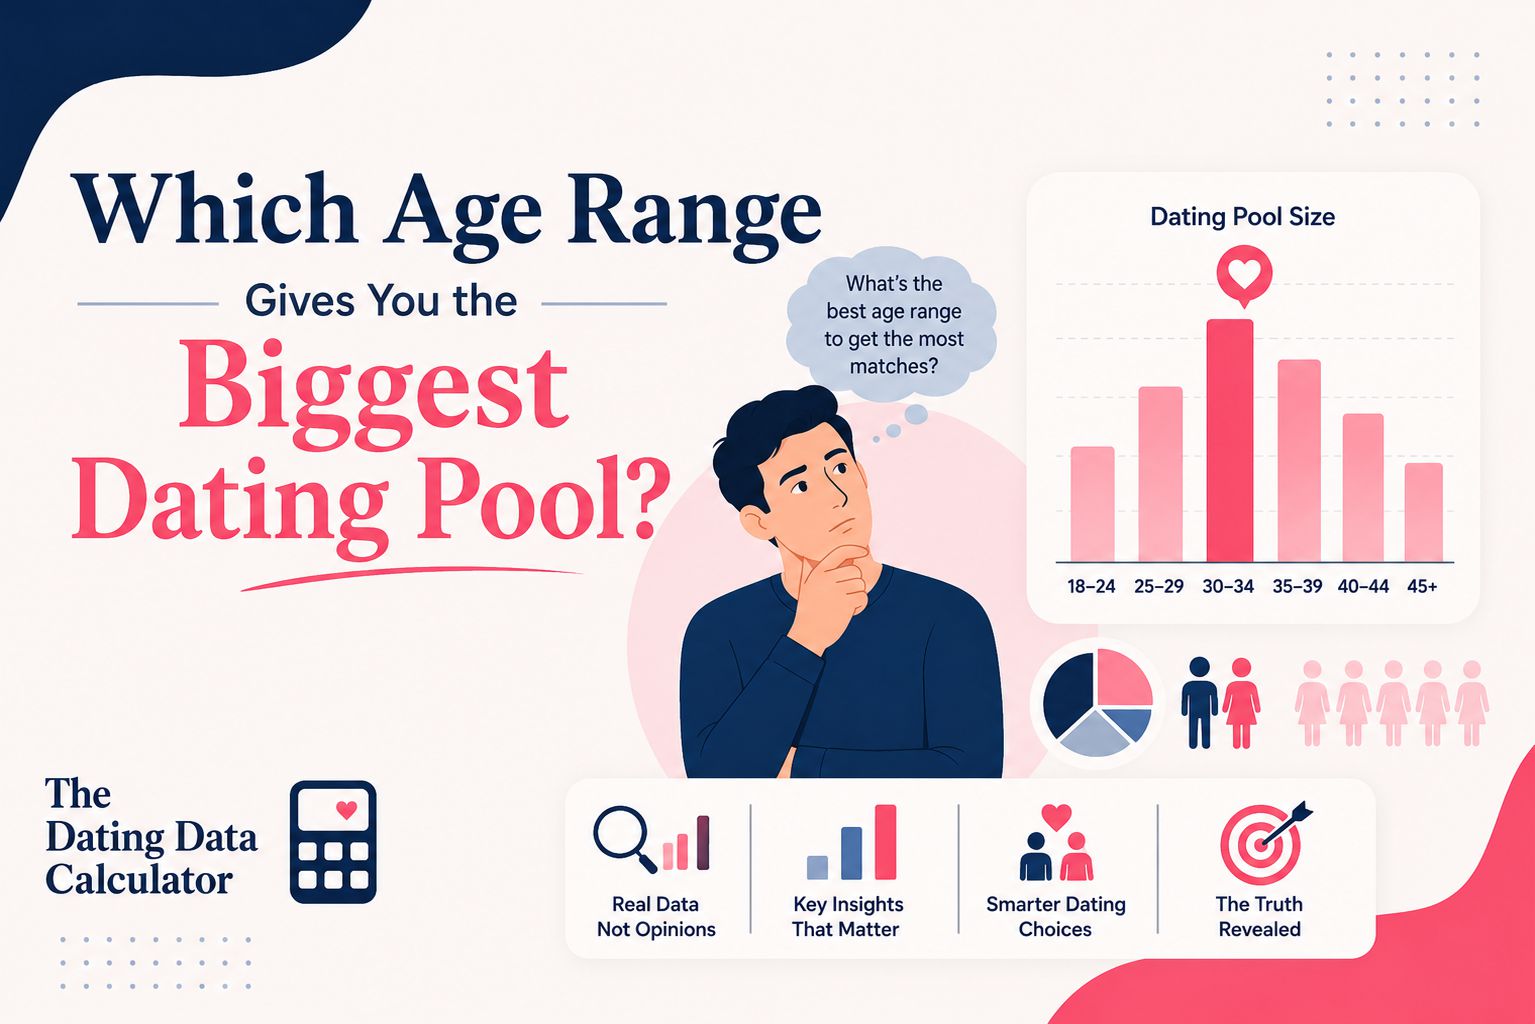
For most people setting a filter, roughly 30 to 39 is the widest band you can realistically use. US Census figures put about 22 million men in that decade, and something close to 11.7 million of them are unmarried. Younger slices look better on paper: the 20 to 29 decade holds around 19 million unmarried men, because nearly everyone in it is legally single. But a filter only pays out if you are plausibly inside it or next to it, and the median person running these numbers is in their thirties. Among bands a thirty-something can actually set without being ignored, 30 to 39 gives the largest count of available adults. This guide walks the arithmetic band by band so you can pick yours instead of guessing.
One setting outweighs all the others
Height, income, and education each cut a percentage off one dimension. Years are different, because that control decides which slice of 258 million American adults you are even looking at before any other rule applies. Set it to a three-year window and you have thrown away roughly 95% of the country before the app asks a single further question. Set it to twenty years and almost nothing else you choose will matter as much.
That is why the same person can run two searches an hour apart and get wildly different answers. Someone who trims their range from twelve years to six has not become pickier about character or looks. They have simply halved the raw supply, and every subsequent filter now multiplies against a smaller starting number. If a search feels empty despite modest requirements, the age control is the first place to look.
This piece is about choosing that band. For the broader question of how availability changes across a lifetime, including what the word single actually means across four competing definitions, read our companion piece on how the pool changes with age. Everything below assumes you have picked a definition and want to know where to put the slider.
Step one: how many people are in each band
Start with raw population, ignoring marital status entirely. American Community Survey estimates from the US Census Bureau put the adult male population at roughly 128 million, spread across the structure shown below. The five-year groups between 20 and 54 are remarkably even, each holding somewhere near 10 to 11.5 million men. There is no bulge to chase and no cliff to avoid until you reach the mid fifties.
Women follow a nearly identical curve until about 60, after which longevity differences open a gap that keeps widening. Below 60 you can treat the two population pyramids as close to interchangeable for planning purposes.
Step two: how many of them are unmarried
Population is only half the equation. The share of adults who have never married falls sharply from the twenties through the forties, and the Census marital-status tables show why. Median age at first marriage sits near 30 for men and 28 for women, up several years from where it stood a generation ago. That single statistic explains the shape of every table below: through the early twenties almost nobody has married yet, and the drop-off concentrates in a seven or eight year window on either side of the median.
Note the word unmarried rather than never married. Unmarried counts divorced and widowed adults alongside those who never wed, which is the honest denominator for a dating search because a divorced 44 year old is available. Never-married figures alone would understate the older bands badly, since divorce keeps refilling them.
The full picture, band by band
Combining the two gives the number that actually matters: how many unmarried men sit inside each window. Population figures are rounded Census estimates. Unmarried shares are rounded from Census marital-status data. The resulting counts are modeled and approximate, and should be read as a scale rather than a headcount.
| Band | Men (approx) | Unmarried share | Available pool (approx) |
|---|---|---|---|
| 20 to 24 | 11.0 million | 93% | 10.2 million |
| 25 to 29 | 11.3 million | 78% | 8.8 million |
| 30 to 34 | 11.5 million | 57% | 6.6 million |
| 35 to 39 | 11.0 million | 46% | 5.1 million |
| 40 to 44 | 10.5 million | 40% | 4.2 million |
| 45 to 49 | 10.2 million | 38% | 3.9 million |
| 50 to 54 | 10.3 million | 38% | 3.9 million |
Read down the middle column and you see something counterintuitive. Cohort size barely moves. Every five-year group from 20 through 54 holds between 10.2 and 11.5 million men, a spread of about 12%. The fourth column, meanwhile, falls by more than 60% across the same stretch. Nearly all of the change in availability comes from marriage, not from demography.
That has a practical consequence. Moving your filter five years younger does not find you more people. It finds you the same number of people, a larger fraction of whom happen to be unattached. The supply of humans is flat; the supply of single humans is not.
Rolling the bands into decades
Most searches use a window closer to ten years than five, so here is the same data collapsed. These are the four decade options a typical adult would consider.
| Decade window | Men (approx) | Unmarried pool (approx) | Share of the decade |
|---|---|---|---|
| 20 to 29 | 22.3 million | 19.0 million | 85% |
| 25 to 34 | 22.8 million | 15.4 million | 68% |
| 30 to 39 | 22.5 million | 11.7 million | 52% |
| 35 to 44 | 21.5 million | 9.3 million | 43% |
| 40 to 49 | 20.7 million | 8.1 million | 39% |
Strictly by headcount, the youngest window wins and it is not close. Nineteen million unattached men in a single decade is roughly double what 30 to 39 offers. So why did this article open by recommending the thirties?
Why the biggest count is not the best choice
Because a filter is not a shopping list, it is a two-way match. You can set your slider to 20 to 29, but the people inside it are setting sliders too, and most of those are not pointing back at you. A 38 year old who searches for 24 year olds has technically enlarged the visible supply while shrinking the number of people who will return interest, often to something below what a same-decade search would have produced.
The honest way to read the decade table is as a ceiling, not a forecast. What you can realistically reach is the overlap between the band you set and the bands that set you. For anyone in their thirties, that overlap peaks somewhere between 30 and 42. For someone in their late twenties it peaks a few years lower. The tables tell you what exists; how old you are tells you which part of it is reachable.
Two things make the thirties the strongest default for the largest group of searchers. First, cohort size is at its maximum there, with the 30 to 34 group the single largest five-year block of adult men in the country. Second, availability is still above half, so the arithmetic has not yet turned against you the way it does after 40. You get a full-size cohort and a coin-flip chance of a single person in one window. No other decade offers both.
What widening the range actually buys you
The single most useful thing you can do to a search is add years symmetrically. Take a searcher with 30 to 39 set. Extending five years in each direction produces a 25 to 44 window. The additions are the 25 to 29 group at about 8.8 million and the 40 to 44 group at about 4.2 million, a combined 13 million stacked on top of the original count. Ten extra years of tolerance more than doubles the supply.
The gain is lopsided, and that is the interesting part. The younger addition contributed roughly twice what the older one did, purely because marriage has not yet thinned those ranks. Anyone who widens only upward is buying the cheaper half of the expansion. Whether the cheaper half is usable depends entirely on where the searcher sits, which brings the recommendation back to the overlap principle above.
Run the same experiment from a starting point of 40 to 49 and the picture flips. Adding 35 to 39 brings roughly 5.1 million; adding 50 to 54 brings about 3.9 million. The two directions are nearly balanced, because availability has flattened out by then and only cohort size separates them. Past 45, widening is a blunt instrument that works about equally well downward or upward.
A rough rule falls out of all this. Each extra year at the young end of a search set in the thirties adds something like 1.5 to 1.8 million unattached men to the theoretical total. Each extra year at the old end contributes closer to 800,000. That imbalance fades as the anchor age rises and has essentially vanished by the mid fifties.
Men and women set very different ranges
App data and survey work have documented the pattern repeatedly, and it is one of the more stable findings in the whole category. Women overwhelmingly set windows that begin at or just above where they are and reach upward by a handful of years. Men set windows that begin several years lower and, past about 35, often stop climbing at all, staying anchored on the late twenties and early thirties no matter how old the searcher becomes.
The consequence is a structural mismatch that neither side sees from inside its own results. Adults in the 28 to 34 stretch receive attention from nearly every direction at once, while men in their forties and fifties compete for a shrinking slice of interest despite facing a fairly stable supply of unmarried women in the same decade. Women over 45 experience the mirror image: male peers exist in large numbers, but a sizeable share of them have their preferences pointed elsewhere.
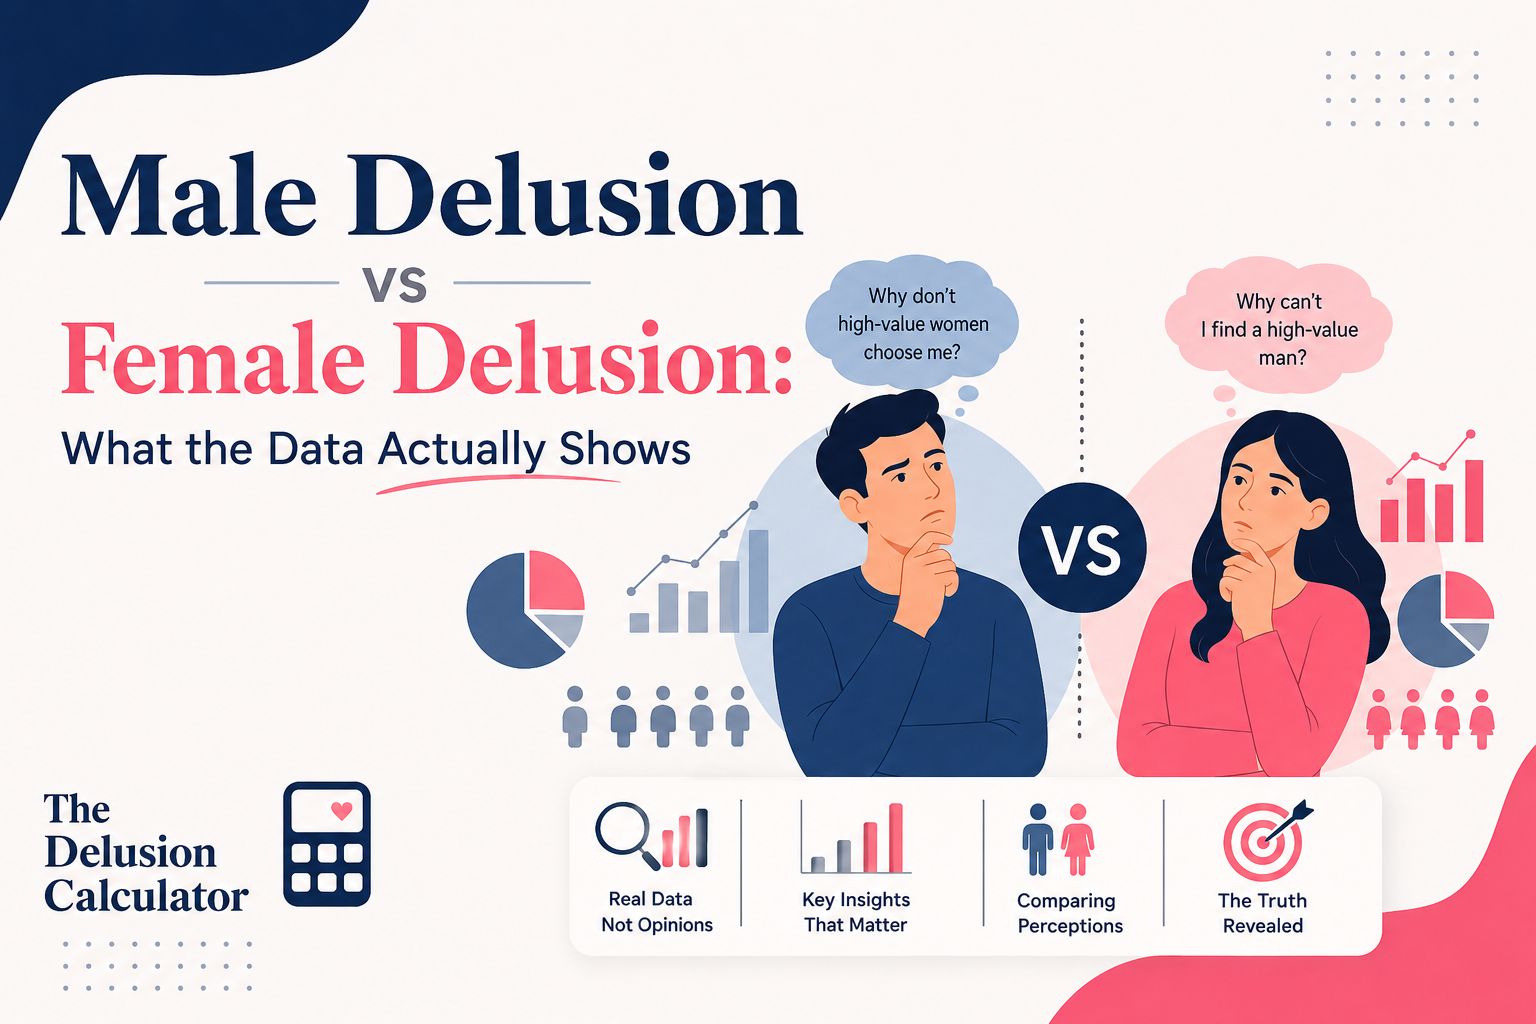
Both patterns show up clearly if you run identical criteria through the male delusion calculator and then the female delusion calculator. Matching standards produce different results by sex, and much of that gap traces back to the years setting instead of to height or income. Our breakdown of how the two sets of standards compare goes into where else the imbalance appears.
Practical takeaway for anyone past 40: the limit on results is usually set by other people's preferences, not by the population. Reaching further down does very little to fix that. Reaching further up, or simply accepting a same-decade match, tends to work far better than the raw counts suggest.
How to pick your band in four steps
- Anchor on yourself, then extend. Sit inside the window instead of at its edge. A 34 year old choosing 30 to 39 falls within the largest cohort in the country and within the band most other people are already searching.
- Buy years before you buy anything else. If a search returns too few people, add three years to each side before relaxing any other requirement. Time is the cheapest expansion available, and in most cases it costs nothing you genuinely care about.
- Check availability, not just the count. A window centered on 47 contains almost as many men as one centered on 32, but fewer than four in ten are unattached. Knowing which constraint is binding tells you which direction to widen.
- Account for geography. National figures assume a national market. In a metro area of 200,000 adults, every count above scales down by roughly a factor of a thousand, and a half-decade span can leave you with a genuinely small candidate list.
None of this implies a correct answer. A 55 year old who wants a partner at the same life stage is doing nothing wrong by choosing a small window; they are accepting fewer candidates in exchange for a better fit. The tables exist to make that trade visible.
Where age stacks with everything else
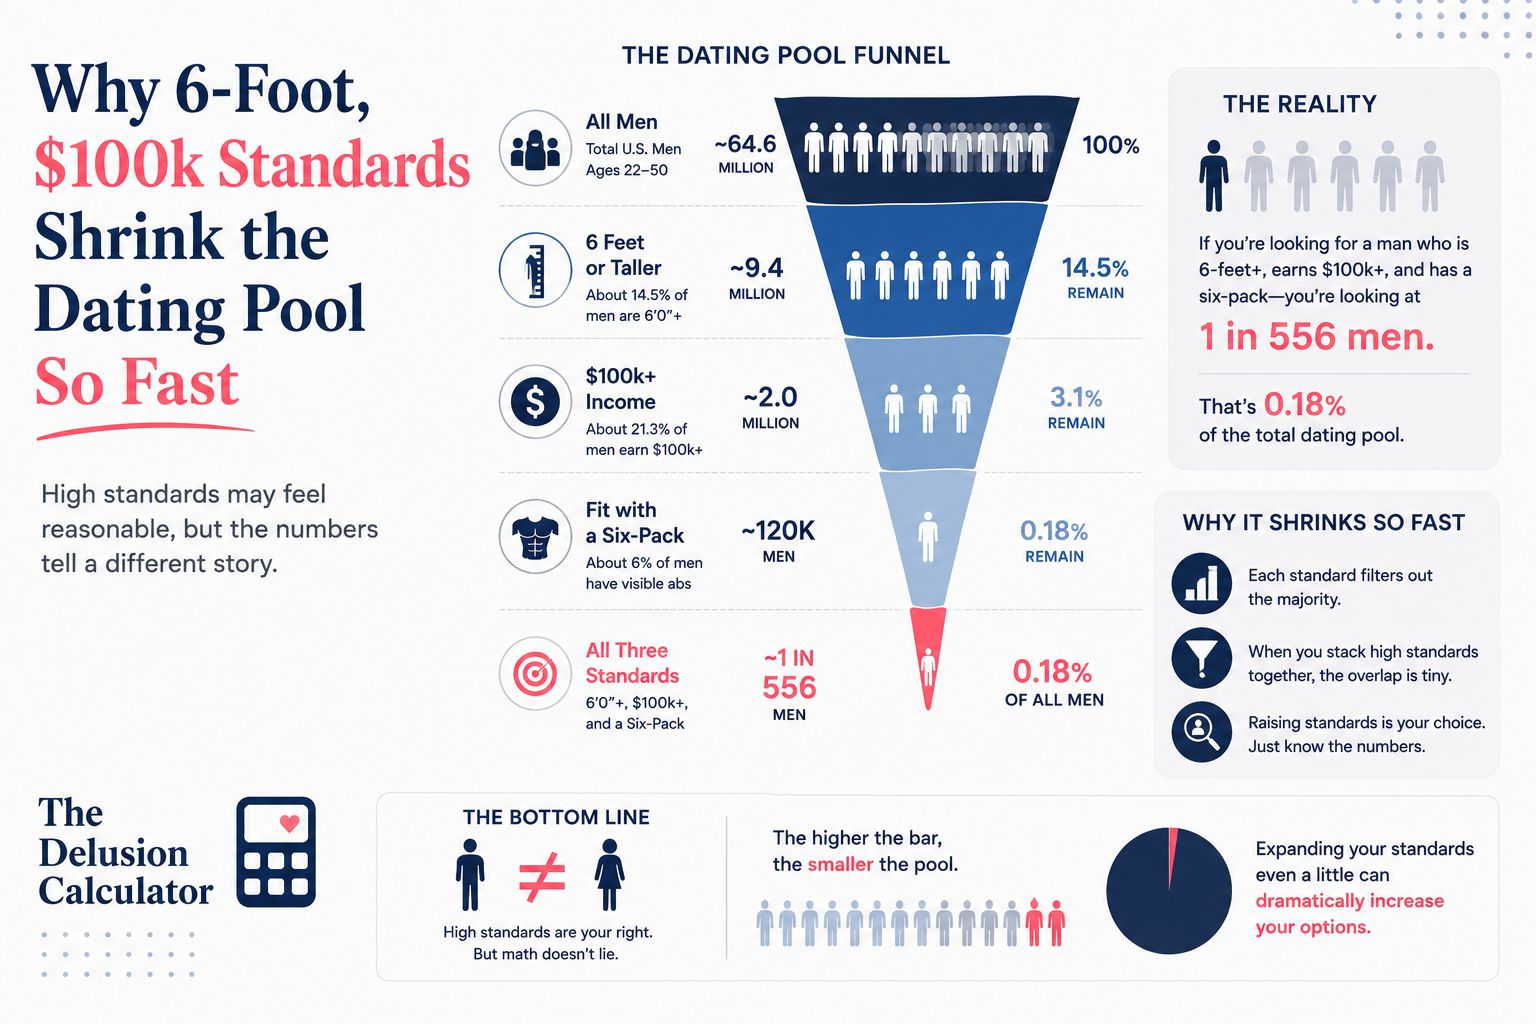
Filters multiply. A decade holding 11.7 million single men shrinks to roughly 1.7 million once you add a six-foot minimum, since only about 15% of American men reach that height according to CDC NHANES measurements. Layer a six-figure income requirement on top, which Census and BLS income data suggest fewer than one in five men meet, and the survivors number in the low hundreds of thousands nationally. Our piece on why those two standards cut so deeply works through the compounding in detail, and the 6-6-6 rule explainer covers the version of this that circulates on social media.
What makes years unusual in that stack is that they are the only input you can loosen at zero cost to your actual preferences. Height and income are things people say they want. A setting of 32 to 38 versus 30 to 40 is rarely a preference at all; it is an arbitrary default that most people never revisit after choosing it once.
The site's delusion score, which runs from 1 to 10, weights this input heavily for exactly that reason. A tight window paired with demanding physical and financial requirements is what pushes a score into the upper part of the scale. You can see the full weighting in the scoring breakdown, and the data sources behind every figure here are documented in our methodology.
Quick summary
- Cohort sizes are nearly flat from 20 to 54, so availability differences come almost entirely from marital status.
- By raw count, 20 to 29 holds the most single men at roughly 19 million.
- By reachable count for a typical adult searcher, 30 to 39 is the strongest single decade, with about 52% of a very large cohort still unmarried.
- Adding five years to each side of a thirties window more than doubles the theoretical total.
- Below 45, a younger extension is worth about twice as much as an older one; past 45 the two even out.
Frequently asked questions
Which age range gives the biggest dating pool for someone in their thirties?
Roughly 30 to 39, which holds about 22.5 million American men, of whom roughly 52% are unmarried. That window pairs the largest cohort in the adult population with an availability rate still above half. Stretching it to 28 to 42 adds several million more without reaching into ages that are unlikely to reciprocate.
Does widening an age range always increase the number of matches?
No, it increases theoretical supply but not always the response rate. Reaching far younger than you are enlarges the visible list while adding people whose settings exclude you, so the count of those who might actually reply can stay flat or fall. Balanced expansion in both directions reliably helps; one-sided expansion downward often does not.
What is an age filter in dating terms?
An age filter is the minimum and maximum you are willing to consider, which determines what slice of the adult population every other requirement gets applied to. It runs before height, income, or education in any search, so it sets the starting number that all later constraints multiply against. A ten-year setting covers roughly 22 million American men; a three-year setting covers about 6.5 million.
Is a 25 to 34 window better than a 30 to 39 window?
For pure headcount yes, since 25 to 34 contains roughly 15.4 million single men against about 11.7 for the thirties. Whether it suits you depends on how old you are, because the reachable portion is the overlap between what you set and what others set. A 27 year old should prefer the younger option; a 36 year old will usually do better higher up.
How many unmarried men are there aged 30 to 39?
Roughly 11.7 million, based on Census population estimates of about 22.5 million men across that decade and marital-status data showing around 52% of them unmarried. That total counts divorced and widowed men alongside those who never wed. Restricting it to never-married status alone would cut the number by a few million.
Do men and women set the same age windows?
No, and the gap is well documented. Women typically begin at or just above where they are and reach upward by roughly a decade, while men usually start several years lower and often cap the upper end near the early thirties as they get older. That mismatch concentrates attention on the late twenties and leaves men over 45 competing for a thin slice of interest.
What percentage of American men aged 30 to 34 have never married?
Somewhat under 60% of that group are unmarried in total, with the never-married portion accounting for the large majority since divorce is still uncommon by then. The proportion drops steeply through the decade because median age at first marriage for men sits near 30, so this is precisely where the curve bends. By 40 to 44 the unmarried figure has fallen to about 40%.
Which shrinks a search faster, a short age span or a height minimum?
A short age span, in most realistic cases. Cutting from ten years to three removes about 70% of the starting population, while a six-foot minimum removes roughly 85% of men but applies only to whatever survived the first cut. Because years run first and the two multiply, shaving a few of them is usually the more expensive move.
Can widening your age range lower your delusion score?
Yes, and it is typically the fastest single change available. The scoring model treats a cramped range as a strong contributor because it removes supply before any preference has been expressed. Going from a four-year span to a twelve-year one around the same center point can move a score by two points or more, depending on what else is chosen.
What is the median age at first marriage in the United States?
Around 30 for men and 28 for women, according to Census Bureau figures, and both have climbed by several years over recent decades. That rise is the main reason the thirties now hold a much larger single population than they did for earlier generations. It also explains why the sharpest fall in availability lands between 28 and 38 instead of in the mid twenties.
Who benefits most from a narrow age window?
People searching in dense metro areas who want a partner at a specific life stage, such as someone planning children on a defined timeline. Narrowing costs them supply they can afford to lose, because the local population is large enough to absorb the reduction. Anyone in a smaller market, or anyone past 45, gives up far more than they gain.
Is finding an unmarried partner harder at 45 than at 30?
Yes on a per-capita basis, since roughly 38% of men aged 45 to 49 are unmarried against 57% at 30 to 34. In absolute terms the difference is smaller than it feels, because those later groups still contain millions of divorced and never-married adults. The real constraint after 45 is usually competition and mismatched preferences rather than a shortage of people.
Should I sit at the edge of my chosen range?
No, place yourself near the middle so the window captures people slightly older and slightly younger. Ranges anchored at one end waste half their reach, and they tend to exclude the group most likely to reciprocate. Five years below to five years above is a sensible starting configuration for anyone between 25 and 55.